Demo blog post !!
·116 words·1 min
This is a demo blog post for my homepage.
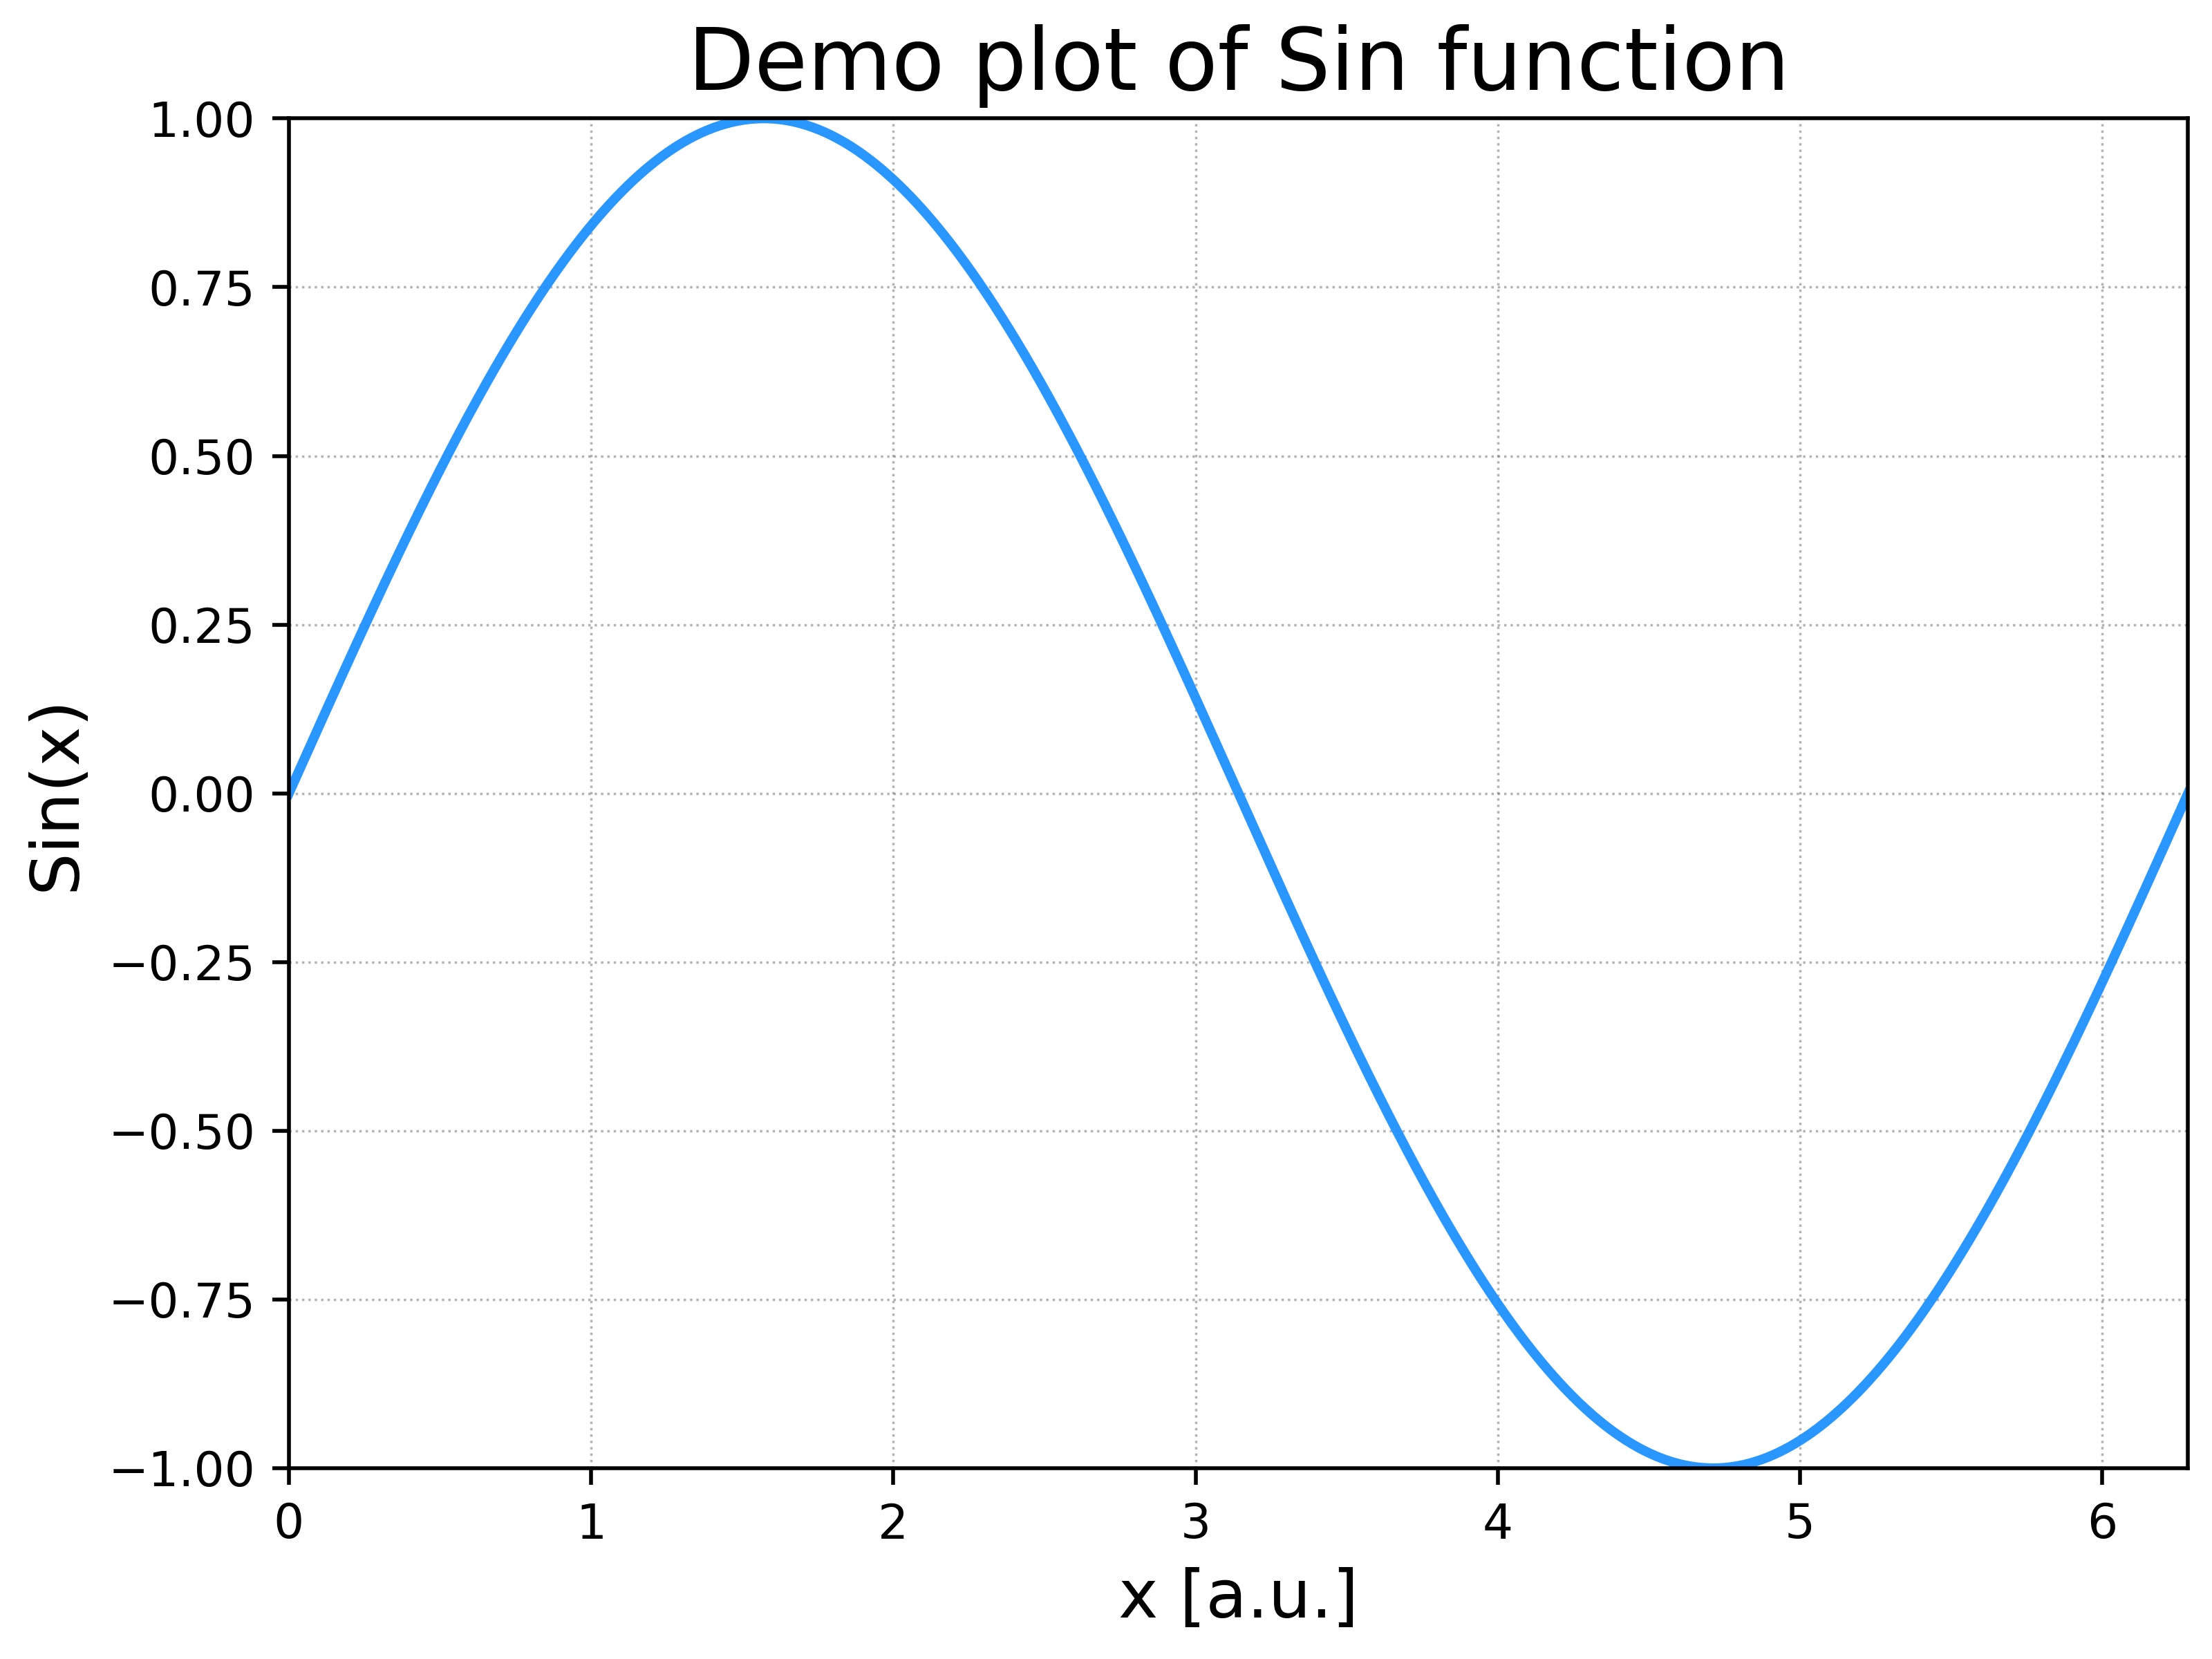
Here, a small code-snippet is given to demonstrate how to plot and save a simple function in Python, using Numpy and Matplotlib.
    import numpy as np
    import matplotlib.pyplot as plt

    # Data generation and plotting
    x = np.linspace(0, 2* np.pi, 1000)
    plt.plot(x, np.sin(x), ls="-", color="dodgerblue",
             alpha=0.95, lw=2)

    # Add grids
    plt.grid(True, color="dimgrey", lw=0.5, alpha=0.5,
             ls="dotted")

    # Add axes labels and limits
    plt.xlim(0, 2*np.pi)
    plt.ylim(-1, 1)
    plt.xlabel("x [a.u.]", fontsize=14)
    plt.ylabel("Sin(x)", fontsize=14)

    # Add title
    plt.title("Demo plot of Sin function", fontsize=18)

    # Save plot
    plt.tight_layout(pad=0.5)
    plt.savefig("demo_plot.jpg", facecolor="white", dpi=500)
And here is the saved image
Happy blogging !! 🙈